45 Lab Metrics You Need to Track [Download the Full List]

If you aren’t keeping a close eye on your lab’s data, processes, or numbers, then your grasp of how efficient and compliant you are will be loose at best and fictitious at worst.
We know: a lengthy list of 45 metrics to track is about as appealing as a surprise visit from the FDA. But that’s precisely why these metrics matter. If you don’t monitor your lab’s processes, operations, compliance efforts, and customer relationships, every decision you make will come from a black box, making those visits even more stressful.
And we’ve all heard the horror stories of labs that waited until it was too late to take their processes seriously.
We’ve pulled together the most critical metrics labs need to get a read on to run smoothly, scale smartly, and manage compliance. Bounce around by section, and don’t forget to download the list for the full companion guide:
Why Bother Tracking These Metrics in Your Lab?
The KPIs we collected provide a holistic view of your lab’s health by measuring performance across activities, processes, and services. Tracking the right KPIs ensures your lab runs smoothly, instruments are correctly calibrated, and test results are accurate.
The metrics we explore in this article will give you an overview of:
- Business metrics
- Operations metrics
- Quality assurance/quality control
- Productivity and efficiency
- Compliance and safety
- Customer satisfaction
Keeping track of these metrics across your lab results in an organized and efficient lab that spends less time wondering where things are going wrong and more time getting things done.
Here’s a real-life example to illustrate why this matters.
We spoke to a lab that managed everything in a paper-based system. They had a loose system of 4x6 notecards and physical logbooks that grew and grew over the years to the point that they were impossible to sift through and terribly error-prone.
Once, during an audit, the auditors refused to touch the physical materials, demanding digital records they could easily and safely review. As you’ll see in this guide, it’s not just a matter of having records, period. You need to ensure they are secure and easily accessible at a moment’s notice.
6 Business Metrics Your Lab Should Track
You need to keep track of revenue, costs, and your bottom line to keep things running smoothly. Here are the top business metrics a lab should track:
- Monthly, quarterly, and yearly orders
- Revenue: month over month and annually
- Revenue per sample analysis
- Cost for sample analysis
- Customer retention
- Capacity utilization
Monthly, Quarterly, and Yearly Orders
Track the number of orders broken down by the past month, quarter, and year to help your lab identify demand patterns and seasonal trends and better allocate resources (and staff) to keep up with demand.
Why this matters: Seasonal demand swings can wreck resource planning. For example, a materials testing lab might get slammed in Q4 when manufacturers rush validation before year-end. Tracking orders over time helps you avoid chaos and shortages.
Revenue: Month-Over-Month (MoM) and Annually
Revenue matters. It keeps the lights on and serves as oxygen to the cutting-edge work you do. It’s vital to track revenue month-over-month and annually, as it helps you monitor your lab's financial performance and properly estimate your budget.
Why this matters: Labs often confuse volume with profit. You can be busier than ever while still losing money on low-margin tests. Watching revenue trends ensures growth is sustainable, not just frantic.
Revenue per Sample/Analysis
While tracking overall revenue, we recommend keeping track of where it comes from. Keeping an eye on revenue per sample/analysis gives you insights into the profitability of your lab’s services and can help you better allocate resources.
Why this matters: This exposes unprofitable services. Maybe one client’s low-volume, high-complexity testing eats half a tech’s time for pennies on the dollar.
The Total Cost of Sample Analysis for Each Test Performed
Keeping track of costs is key to lab profitability. It’s essential to understand the cost breakdown for each test type to identify cost-saving opportunities without compromising quality.
Why this matters: True profitability hides in the details: things like reagent waste, reruns, and manual data entry time. Knowing your per-test cost lets you quote accurately and defend your pricing.
Customer Retention
How many customers keep using your lab’s services over time? Keep an eye on the percentage of customers who continue to use your lab's services over time, as well as your churn rate. This helps you maintain strong financial fundamentals to support your work.
Why this matters: Customer churn is a silent killer. A 5% drop in retention can mean tens of thousands in lost recurring revenue and the need to retrain new clients on your submission process.
Capacity Utilization
Are you at capacity? Whether it's equipment, personnel, or physical space, it’s essential to track what your lab can support (people, machines, and volume) and how close you are to your limit. This also helps with better budget allocation as you’ll be able to accurately predict what funds are needed and where they will be used most efficiently.
Why this matters: Idle equipment and burned-out staff both kill margins. Tracking utilization helps you right-size staffing, plan instrument purchases, and justify automation investments.
8 Lab Operations Metrics
A smooth, efficient lab wastes little time and gets more done. The following metrics are the top lab operations metrics you should be tracking:
- Sample throughput
- Turnaround time
- Test volume
- Reagent and Supplies Inventory Turnover
- Equipment utilization
- Equipment calibration and maintenance
- Specimen rejection rate
- First Pass Yield (FPY)
Sample Throughput
Sample throughput tracks the number of samples processed in a given period. This gives you an overview of your lab’s capacity and volume. Tracking this at different intervals throughout the year allows you to spot trends and allocate resources accordingly.
Why this matters: Sample throughput is the heartbeat of your lab. If throughput dips, it signals upstream bottlenecks like delayed sampling, reagent stockouts, or instrument downtime.
Turnaround Time (TAT)
A core metric for any lab: how long does it take to go from sample receipt to result delivery? TAT is a critical measure of customer satisfaction and operational efficiency, as it indicates how quickly your lab completes analyses.
It’s critical to define TAT clearly so it can’t be fudged:
- Start: when the sample is accessioned, meaning fully logged, labeled, and ready for analysis (not when it first arrives at the door).
- Stop: when the final report is issued to the client or system of record.
Track Preliminary Report TAT separately if you issue early data releases. For outsourced or reference testing, record Reference TAT as its own category.
Why this matters: Long TATs frustrate clients and, with enough delays, can cost contracts. Every hour of delay can mean product recalls, halted shipments, or idle production lines. Rising TAT with flat throughput often points to approval bottlenecks or scheduling gaps; rising TAT with falling throughput usually means equipment downtime, reagent shortages, or excessive reruns.
Test Volume
Similar to sample throughput, keep an eye on the total number of tests performed within a specific timeframe. This metric helps understand the demand for different test types and plan resource allocation accordingly.
Why this matters: Test volume helps you track demand shifts across services. If certain assays spike, it might justify new automation or an additional LIMS workflow.
Reagent and Supplies Inventory Turnover
As you run through reagents and supplies, you must have a way to measure your inventory usage and status. Inventory management ensures your lab operates without delays and helps you manage storage costs. While some labs may manage inventory with spreadsheets, we recommend investing in a LIMS (lab information management system) to manage inventory, sample tracking, and more.
Why this matters: Many labs find the hard way that trying to track this in Excel/Google Sheets leads to expired reagents. That’s where a LIMS (laboratory information management system) can help. For example, a LIMS like QBench can calculate turnover and alert you before stock runs out or expires.
Equipment Utilization
Labs invest millions of dollars into specialized equipment. To maximize your return on that investment, it is important to optimize how equipment throughout the lab is used, ensure peak productivity, and minimize idle time for maintenance or calibration.
Why this matters: Labs often discover instruments are idle (sometimes up to 40% of the time), or worse, your techs are queuing to wait for equipment and not coordinating work effectively. Either way, you’re looking at wasted capital and a sign that workflows aren’t balanced across teams.
Equipment Calibration and Maintenance
Equipment calibration and maintenance are critical to ensuring your lab equipment and instruments function correctly. And that means accurate results and trustworthy data.
Why this matters: Equipment calibration is one of those things that takes seconds/minutes and saves you hours of backtracking bad data. Meanwhile, missed maintenance results in failed QC, invalid data, and the risk of failing an audit.
Specimen Rejection Rate
Specimen rejection rate tracks the percentage of samples rejected due to improper collection, labeling, transport, or storage. Reducing this rate improves operational efficiency and reduces wastage.
Why this matters: Each rejected sample represents wasted time, reagents, and client trust. Often, it’s preventable due to bad labeling, improper transport, or incomplete paperwork.
First-Pass Yield (FPY)
First-pass Yield (FPY) measures the percentage of products or services completed correctly the first time, without rework or scrap. Often used in manufacturing labs, you can calculate first-pass yield by dividing the number of good units by the total number of units produced, then multiplying by 100.
Why this matters: High FPY means your team is doing it right the first time. Low FPY means rework, reruns, and downtime – a classic efficiency bellwether.
10 Quality Assurance/Quality Control Metrics Your Lab Should Track
Quality assurance and quality control help ensure your lab results are accurate and reproducible, and that your lab is compliant with various regulations. Measuring your quality assurance activities helps demonstrate a commitment to quality control and keeps your lab running smoothly and efficiently.
The top quality assurance/quality control metrics to track are:
- Accuracy and precision
- Control sample test results
- Downtime and response times
- Occupational health and safety incidents
- Error rates
- Error reduction rate
- Test reproducibility
- Corrective actions for QC failures
- Document control and record keeping
- Turnaround time for QC issues
Accuracy and Precision
Accuracy and precision are often confused, but there is an important difference between them.
Accuracy refers to how close the test results are to the actual value, whereas precision refers to how repeatable the results are. Here’s an illustration of the differences using a dartboard:
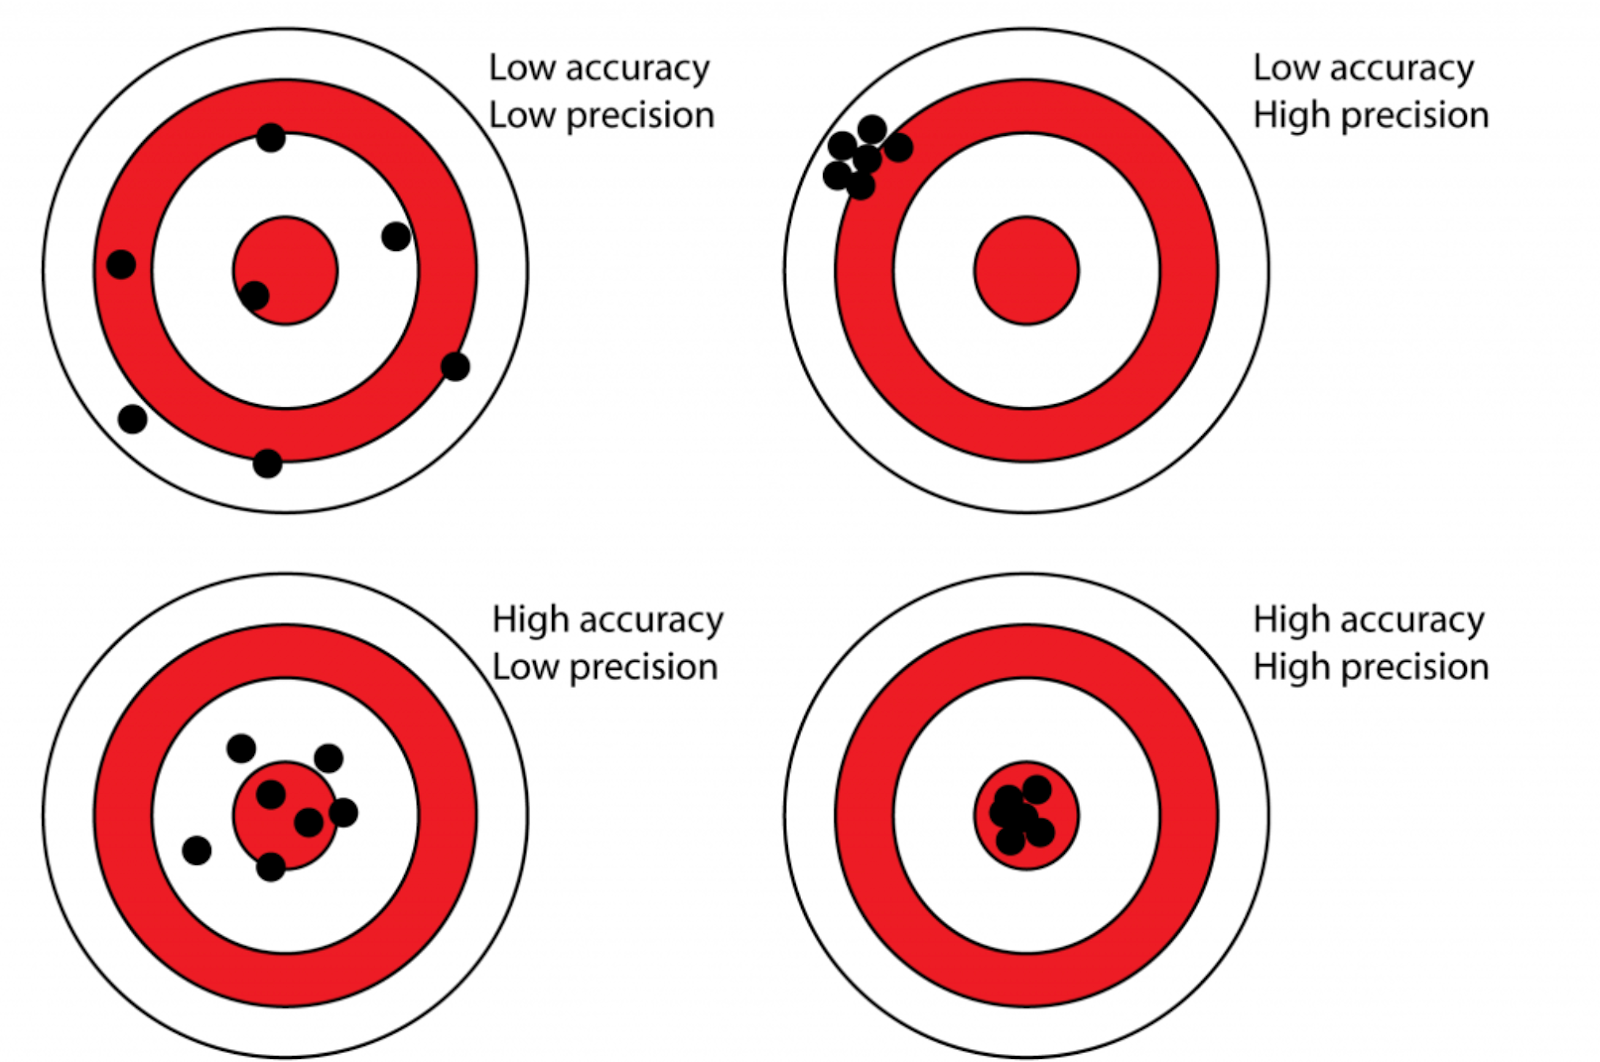
Both accuracy and precision are critical for ensuring the reliability of lab tests.
Why this matters: The difference between “close” and “consistent” is the difference between compliance and a CAPA nightmare. Regulators don’t care if you meant to be accurate; they only care how precise and reliable your data is.
Control Sample Test Results
The analysis of control samples with known values alongside patient or environmental samples to ensure the testing system is working as expected. Deviations in control sample results can indicate potential issues with test accuracy.
Why this matters: Drift in control results is your early warning system. Ignore it, and you’ll discover systemic errors only when clients complain or audits start.
Downtime and Response Times
In the event of downtime, use it as an opportunity to measure how long it lasts, how quickly you can identify and resolve the root cause, and how quickly you can resume operations. Downtime can be a disaster, but the extra hours you lose due to a poor response make it all the worse.
Why this matters: Every minute an instrument sits idle waiting for service costs productivity. Tracking this shows which vendors or SOPs are bottlenecks.
Occupational Health and Safety Incidents
It’s a good practice to stay on top of health and safety incidents in your lab, especially in industries where lab techs may come into contact with hazardous materials. A lower number indicates a safer working environment for lab personnel and fewer compliance issues.
Why this matters: Each incident marks a safety risk and a compliance liability. OSHA and ISO inspectors both consider trend data, not just isolated events, when assessing how problematic your safety practices are.
Error Rates
Not only do errors lower the productivity of your lab, but they can also put the lives of those who depend on your test results in danger. For example, a clinical lab will go to great lengths to measure test error rates to ensure accurate results and patient safety. No matter your industry, staying on top of error rates and reducing errors can help your lab remain productive.
Why this matters: In regulated environments, one transcription or labeling error can invalidate days of work. When your lab hinges on the reliability of your data, this is a vital metric to demonstrate.
Error Reduction Rate
Besides tracking your error rate, it’s worth monitoring the rate at which errors are reduced through automation or other process improvements. By automating key systems, you can minimize human errors and increase the accuracy and reliability of laboratory results.
Why this matters: This shows whether your automation or training investments are paying off. If automation’s in place but error reduction is flat, something’s wrong in setup or SOPs.
Calibration Verification
This measures regular checks to ensure instruments are accurately calibrated in accordance with manufacturer specifications and industry standards. Proper calibration is critical for accurate test results. Adherence to scheduled preventive maintenance for laboratory equipment to prevent unexpected failures and ensure consistent performance.
Why this matters: Like equipment maintenance, this can take minutes to do and save hours down the line by preventing bad data and double work.
Corrective Actions for Quality Control Failures
This measures the timely identification and correction of issues leading to QC failures, including the implementation of corrective actions and monitoring their effectiveness.
Why this matters: CAPA helps demonstrate your lab’s responsiveness: slow corrective actions snowball into systemic issues that auditors will find.
Document Control and Record Keeping
It’s essential to monitor the proper management of documents and records, including test procedures, calibration records, and QC data, to ensure compliance with regulatory standards and facilitate audits.
Why this matters: The fastest way to fail an audit? Produce an outdated SOP or incomplete log. Document control is the unsung hero of compliance.
Turnaround Time for QC Issues
Much like turnaround time for lab tests, the turnaround time for QC issues measures how long it takes to identify, address, and resolve quality control issues in your lab. This shows how responsive your lab is to quality control failures, which impacts the overall efficiency and reliability of lab operations.
For modern labs, a QMS (Quality Management System) can help manage quality assurance and quality control. QBench LIMS has an integrated QMS, bringing your lab data, metrics, and quality control under one roof.
Why this matters: Detecting a QC issue fast is good, but fixing it faster is better. Lag here means extended downtime, cascading delays, and annoyed clients.

8 Productivity and Efficiency Metrics Your Lab Should Track
Productivity is a cornerstone of an effective and efficient lab. While many labs would agree they’d like to be more productive, it’s hard to quantify it (or improve productivity) without tracking the following metrics:
- Automation efficiency
- Tests per full-time employee
- Instrument utilization rate
- Reagent and supplies usage efficiency
- Cost per test
- Operational downtime
- Work order cycle rate
- Occupancy rates
Automation Efficiency
Measures the effectiveness of automated processes in terms of time savings, reduced manual effort, and increased throughput. High efficiency indicates successful automation implementation.
Why this matters: Automation only works if it actually saves time. Tracking efficiency proves ROI and helps you spot manual gaps that still eat hours.
Tests per Full-Time Equivalent (FTE)
Tracking tests per full-time employee (or equivalent) helps assess staff productivity and optimize labor costs. It can also be used to understand seasonality and changes in demand throughout the year.
Why this matters: A realistic measure of staff productivity. A sharp drop might mean training gaps, burnout, or upstream bottlenecks, not “lazy techs.”
Instrument Utilization Rate
The percentage of time that instruments are in use versus the total available time. High utilization rates indicate efficient equipment use. This can help you better allocate resources and budget for new equipment.
Why this matters: Overused equipment risks failure while underused equipment signals wasted capital. This metric helps justify CAPEX or workflow redesign.
Reagent and Supplies Usage Efficiency
Reagent and supply usage efficiency tracks consumption relative to the number of tests performed. This helps identify wastage and opportunities for cost savings.
Why this matters: Labs bleed money through reagent waste. Tracking usage exposes careless habits (like techs prepping 10% extra “just in case”).
Cost per Test
The total cost associated with performing each test, including labor, reagents, and overhead. This metric is crucial for financial planning and identifying areas where efficiency can be improved.
Why this matters: When costs creep but prices don’t, margins evaporate. Knowing your per-test cost keeps quotes honest and profitability visible.
Operational Downtime
Pay special attention to the time operations halt due to equipment failure, maintenance, or other issues. Reducing downtime is key to maintaining high levels of productivity.
Why this matters: Downtime is the not-so-hidden productivity killer. Every unplanned halt ripples through TAT, backlog, and client trust.
Work Order Cycle Time
Work order cycle time measures the time it takes to complete a work order from initiation to closure. This helps in understanding workflow efficiency and identifying bottlenecks.
Why this matters: Long cycle times expose procedural inefficiencies or approval bottlenecks. This is especially the case in R&D and testing labs.
Occupancy Rate
For labs that manage space and equipment booking, the occupancy rate measures the effectiveness of laboratory space and resource utilization. This can be especially useful for estimating headcount and staff growth.
Why this matters: Space costs money. Tracking occupancy helps you justify expansions or identify underutilized benches before signing a new lease.
8 Compliance and Safety Metrics Your Lab Should Track
Compliance is key to keeping your lab working smoothly and efficiently. Failure to comply with standards can slow you down and cause serious downstream effects throughout your lab.
The compliance metrics we recommend tracking are:
- Data integrity
- Regulatory compliance rate
- Safety incident rate
- Training completion rate
- PPE compliance rate
- Waste management compliance rate
- Chemical and reagent storage compliance rate
- Deviation resolution rate
Data Integrity
Data integrity issues can lead to serious downstream effects and compliance issues. Ensure your lab’s software and systems uphold data integrity and comply with relevant industry regulations and standards. Managing data manually can easily be a nightmare (see the example above), so that’s where you might want to consider investing in a LIMS to improve and monitor data integrity.
Why this matters: A single untraceable data point can invalidate an entire batch report, and regulators don’t forgive manual transcription errors.
Regulatory Compliance Rate
Keep track of the percentage of compliance successes (and failures) with relevant local, national, and international regulations and standards. This includes adherence to protocols for lab practices, data management, and reporting.
Why this matters: This helps gauge audit readiness. A high rate means smooth audits; a low one means weekends spent rewriting SOPs.
Safety Incident Rate
The number of recorded safety incidents or accidents per a certain amount of time/lab hours worked. Safety incident rate is crucial for assessing the effectiveness of safety protocols and training. It also helps gauge the effectiveness of your staff training.
Why this matters: Every incident is a red flag to both OSHA and clients. A rising rate also kills morale.
Training Completion Rate
The percentage of mandatory safety and compliance training sessions completed by staff. This metric ensures that all personnel are up to date with the latest safety protocols and regulatory requirements.
Why this matters: While “trained” doesn’t always mean “competent,” if staff aren’t even completing training, you’re non-compliant by default. In the event of a failed audit, this will be a blinking warning light to regulators.
Personal Protective Equipment (PPE) Compliance Rate
The rate at which staff comply with PPE requirements is critical for preventing exposure to hazardous materials and conditions.
Why this matters: Noncompliance here can invalidate insurance coverage during accidents; it’s also often the first thing inspectors notice.
Waste Management Compliance Rate
Adherence to protocols for properly disposing of hazardous and non-hazardous waste, including biological, chemical, and radioactive materials. This metric is key for environmental safety and compliance.
Why this matters: Improper waste disposal leads to fines and bad press. One photo of mislabeled hazardous waste can cost contracts.
Chemical and Reagent Storage Compliance
Make sure to track your staff’s adherence to guidelines for the safe storage of chemicals and reagents, including proper labeling, segregation, and the condition of storage areas.
Why this matters: Storage errors cause accidents and cross-contamination. A common audit failure point.
Deviation Resolution Rate
Not only should you keep track of deviations in your data, but it’s also important to track their frequency and how long it takes, on average, to identify and resolve them. Again, this bubbles up to having strong data integrity best practices and protocols for handling aberrations and failures.
Why this matters: Deviations are normal — lingering ones aren’t. Slow closure indicates cultural or managerial issues.
5 Customer Satisfaction Metrics Your Lab Should Track
Happy customers keep a business running smoothly (and improve business metrics like growth, revenue, and customer retention). We recommend tracking the following customer satisfaction metrics:
- CSAT or NPS
- Customer complaints & complaint rate
- Customer complaint resolution time
- Quality of customer support
- Support response time
Customer Satisfaction Score (CSAT) or Net Promoter Score (NPS)
CSAT is a helpful way of measuring customer satisfaction through surveys that ask clients to rate their satisfaction with the lab's services on a scale. Meanwhile, NPS measures customer loyalty by asking clients how likely they are to recommend the lab's services to others on a scale of 0-10.
Why this matters: Labs rarely get direct feedback until a client leaves. CSAT/NPS scores are early warning systems for churn.
Customer Complaints & Complaint Rate
The number of complaints coming in is often a function of your customer base and throughput. That said, it’s important to pay attention to the ratio of complaints to customer requests and support inquiries. A higher volume of complaints, especially a higher percentage per inquiry, could indicate unhappy customers or issues with your processes.
Why this matters: Spikes here almost always trace back to TAT or data errors: the two most common root causes in lab audits.
Customer Complaint Resolution Time
The average time it takes to resolve a customer complaint is a critical customer satisfaction metric to track. Faster resolution times are generally associated with higher levels of customer satisfaction.
Why this matters: Clients will forgive mistakes faster than silence. Resolution time is a proxy for responsiveness and communication health.
Quality of Customer Support
This measures the effectiveness, responsiveness, and friendliness of the customer support team. High-quality support is essential for resolving issues and maintaining positive customer relationships.
Why this matters: In competitive B2B labs, service quality is often the only differentiator once technical capabilities are equivalent.
Support Response Time
One common way to move the needle on support quality (or at least the perceived quality of support) is to pay attention to support response times. If your lab is customer-facing, make sure to set and communicate SLAs around when tickets and follow-up questions will be answered. Then – and this is key – monitor how well you honor those SLAs on an ongoing basis.
Why this matters: Clients who wait for updates start shopping for alternatives. Consistent response times build long-term trust.
QBench LIMS includes a customer portal, making it easy for customers to submit requests, view status reports, and more!
What’s the Best Lab Software to Track These Metrics?
You can’t exactly track every one of these 45 metrics in a spreadsheet.
Well, you could, but the resulting process would be error-prone and take up valuable hours. What you need is software specifically designed for the needs of labs.
Which will you choose? Here are the top software platforms we recommend considering to track your lab’s core metrics:
- An ELN: Electronic Lab Notebooks (ELNs) replace traditional paper notebooks with digital documentation systems that can capture protocols, observations, results, and integrate multimedia content while maintaining proper audit trails. They help most when labs need to track a mix of unstructured and structured data.
- A QMS: A Quality Management System (QMS) ensures laboratories meet regulatory requirements and maintain quality standards. This includes audit management, standard operating procedure (SOP) management, and compliance reporting tools.
- A LIMS: A LIMS (Lab Information Management System) is a comprehensive platform that serves as the central hub for sample tracking, workflow management, and data organization. A LIMS can manage sample lifecycles from receipt through disposal, track the chain of custody, and integrate with other laboratory systems.
Of these three platforms, we’d recommend a LIMS as the most fully-featured and powerful. That’s because a LIMS does more than simply collect data. A LIMS can be used to help automate and standardize the following:
- Sample management
- Test workflows
- Reporting
- Compliance processes and remediation
And more. Check out our guide to the best LIMS on the market to browse top platforms and make the right choice for your lab.
Download the guide: The Ultimate List of Lab Metrics to Track
Think of this guide as a helpful reference and starting point for the key metrics any lab should start tracking.
This guide, complete with definitions, is designed to help you make informed decisions and enhance your lab's performance. While a lengthy list of metrics may seem overwhelming, we’d recommend walking through these to benchmark your lab and spot the immediate areas for improvement. This will give you a plan you can follow and a way to start tracking and demonstrating improvement.
Click the button below for a downloadable list of these metrics to save and share with your team.